In the map, explore how freeways divide neighborhoods in
California’s four largest metropolitan regions
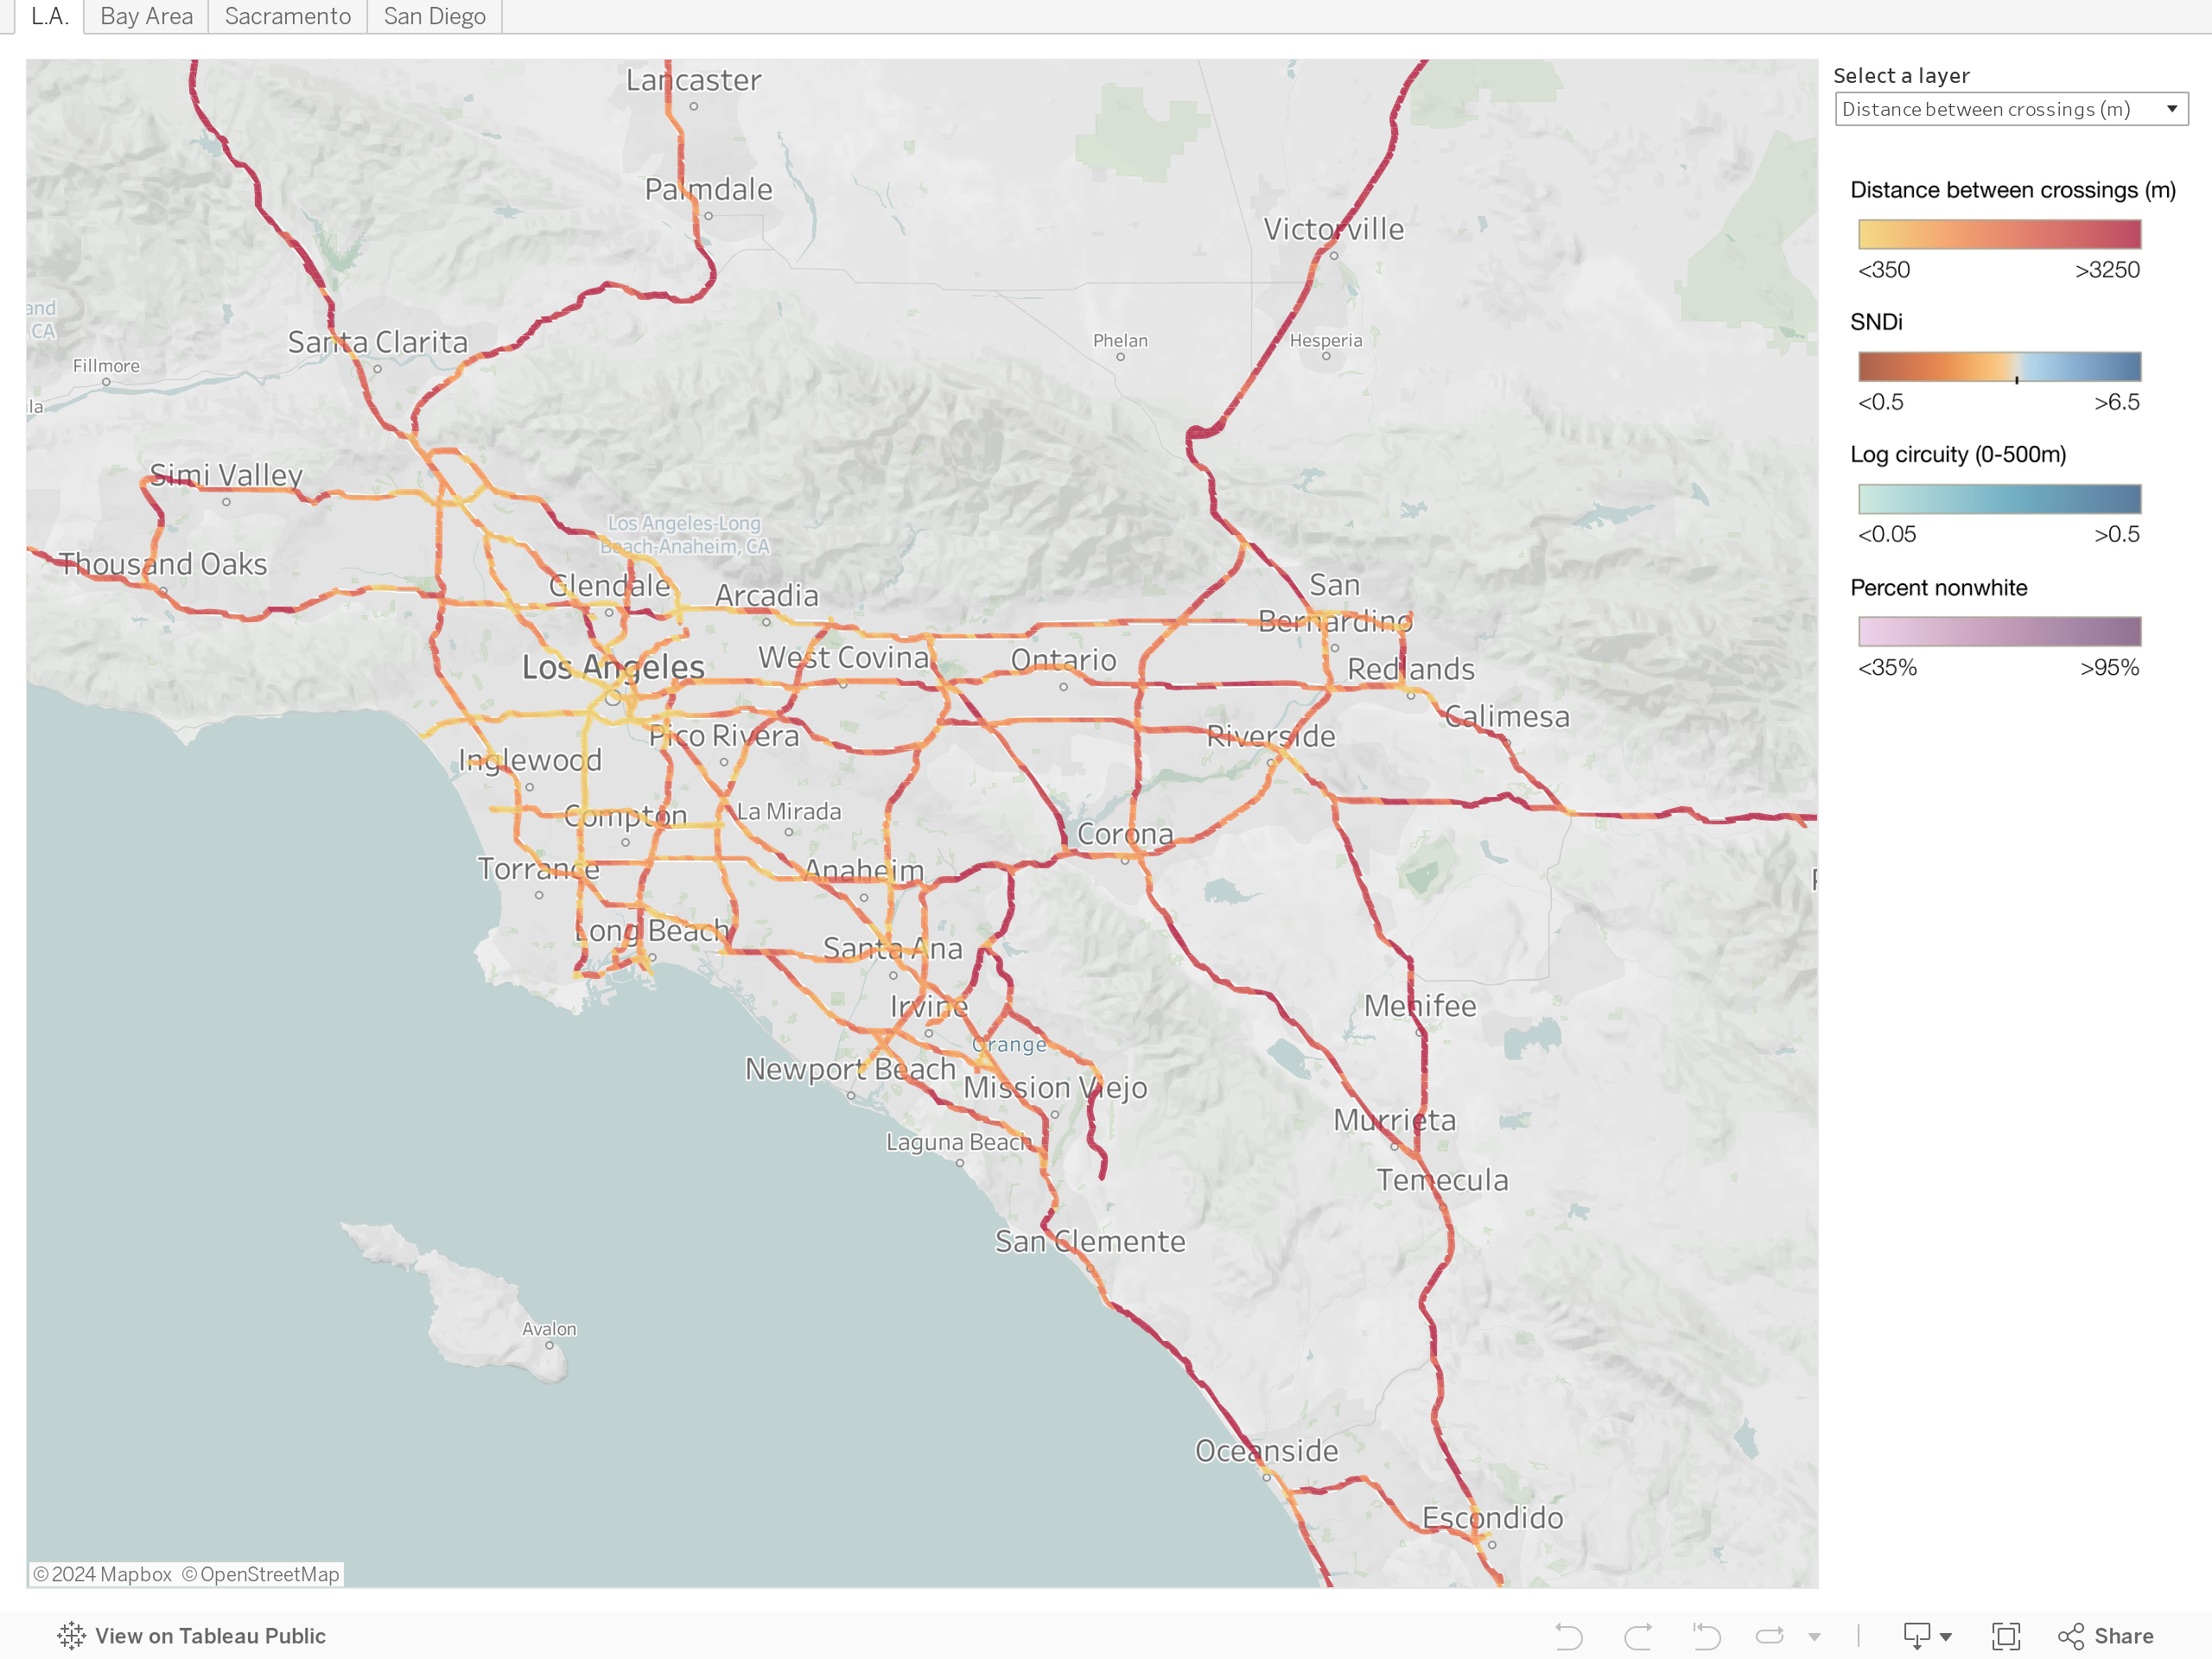
On the map, you can toggle between three measures of severance:
- Distance between crossings. Crossings that are spaced more widely makes it harder to get from one side of the freeway to another.
- SNDi. Low values of the Street Network Disconnectedness Index (SNDi) indicate connected streets, such as a grid. High SNDi values indicate disconnected streets, such as cul-de-sacs and gated communities. Read more about SNDi here.
- Circuity. Higher values indicate more circuitous routes to get between destinations. Circuity is one component of SNDi.
You can also visualize the demographics.
For technical details and more analysis, read the open-access paper in the Journal of Planning Education and Research.
